While climate negotiators from almost 200 countries met in Bonn to hammer out a "rule book" for putting the Paris Agreement into practice, more than 30 scientists gathered in Oslo to discuss how to build an observation system that can monitor the nations’ pledges to cut greenhouse gas emissions.
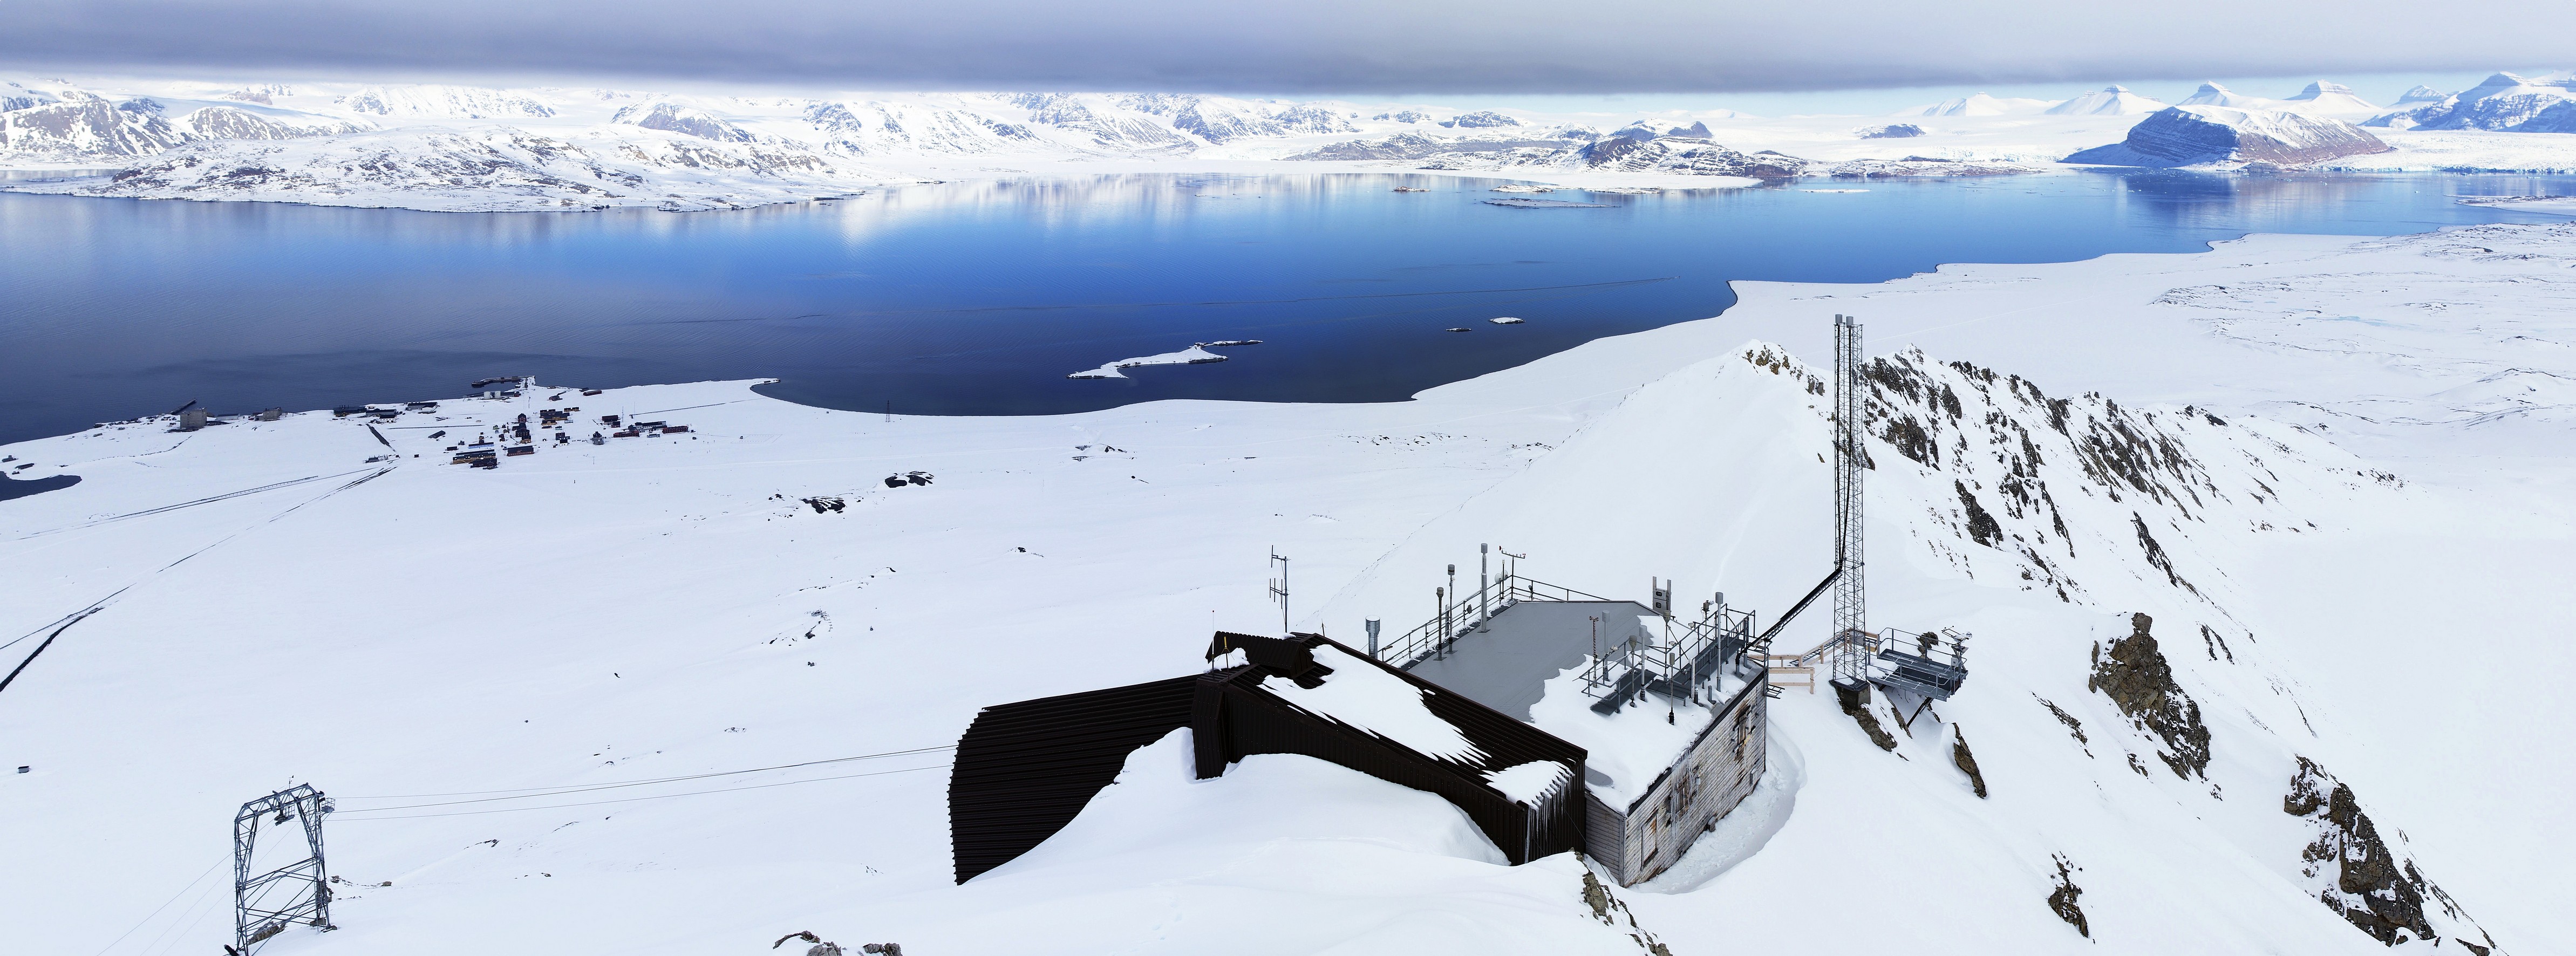
Bilde: Atmospheric observatory in Ny-Ålesund. The remote location in Svalbard, away from large urban and industrial areas, makes this a unique location to monitor changes in global atmospheric greenhouse gases (photo: Ove Hermansen, NILU).
Under the Paris climate agreement nations agreed to try to limit global warming to below 2°C degrees above pre-industrial levels and to reduce greenhouse gas emissions. The ongoing talks in Bonn focus on how countries can report information about their emissions information to the UN, with a final "rule book" to be completed by 2018.
In the meantime, hundreds of scientists and technicians are establishing an independent pan-European infrastructure system called the Integrated Carbon Observation System (ICOS). The task is to measure concentrations of carbon dioxide (CO2) and methane within the climate system and gas fluxes between the land and ocean surfaces and the atmosphere. In turn, atmospheric greenhouse gas emissions and geographical distribution consistent with the measurements will be estimated.
- This monitoring system is operated independently from nations’ reported emissions to the United Nations, and as such, it will provide knowledge on how societies have succeeded in reducing their greenhouse gas emissions and to keep governments accountable, says Professor Truls Johannessen of Uni Research and the University of Bergen.
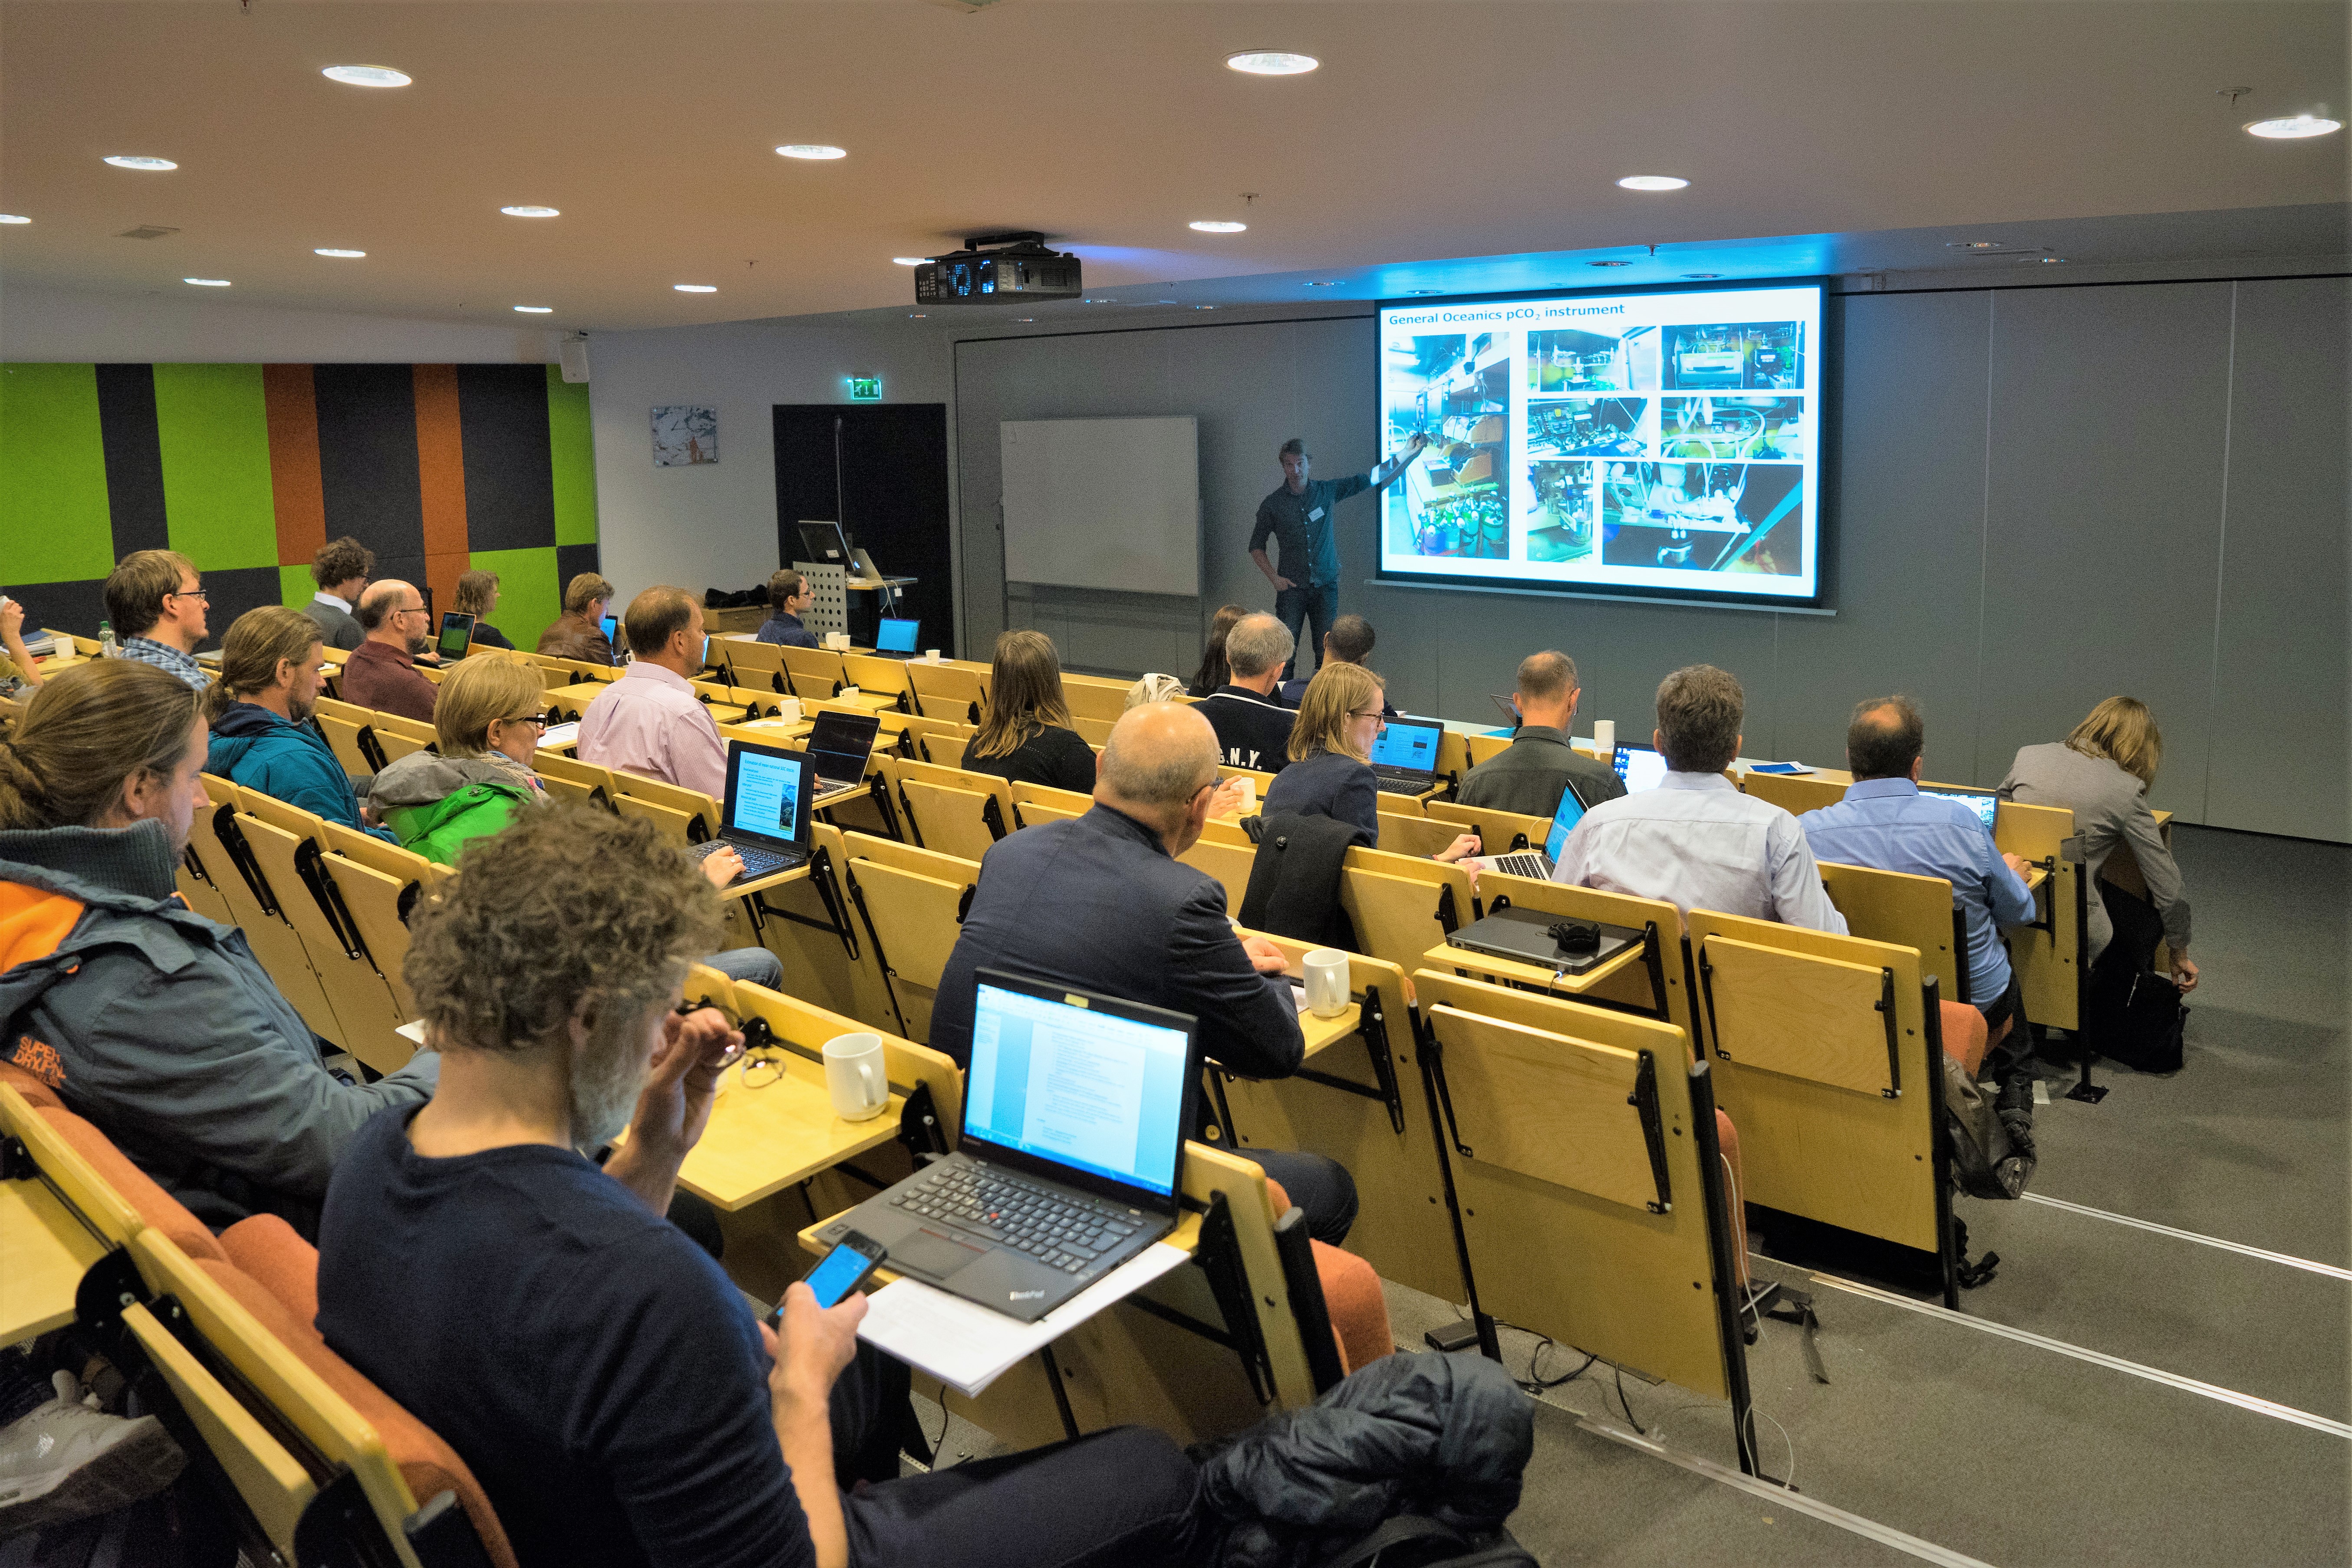
Johannessen leads ICOS Norway, which gathered at Kjeller outside Oslo to sum up progress and discuss the future course of ICOS Norway and participating stations. The national stations form the backbone in ICOS observational system. Currently, ICOS has more than 120 certified observation stations across Europe, including atmospheric, terrestrial and ocean stations.
ICOS Norway is building up its capacity and procedures to measure and quantify greenhouse concentrations and fluxes in the atmosphere, oceans, and terrestrial ecosystems. Currently, the NILU - Norwegian Institute for Air Research - operates two atmospheric stations, the University of Bergen, Uni Research and the Norwegian Polar Institute run four marine stations, and the Norwegian Institute for Bioeconomy Research (NIBIO) is planning one ecosystem station. In addition, scientists from CICERO – the Centre for International Climate and Environmental Research - participate in the project.
No signs of reduction in CO2-concentrations
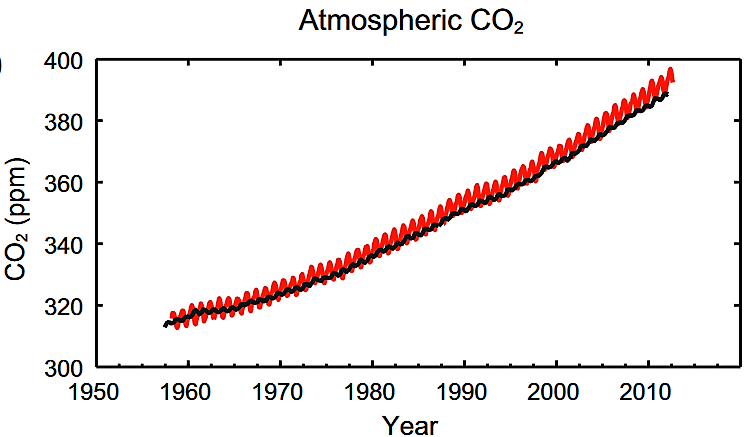
The increase in the atmospheric concentration of CO2 is the biggest driver of climate change observed in modern times.
- Atmospheric CO2-concentrations are increasing each year and we see no sign of it levelling off, says Cathrine Lund Myhre of NILU, which is hosting the meeting outside Oslo.
In spite of the reported emissions to the UN indicating a slight flattening out, it is not yet visible in measurements of the global mean CO2-concentrations. Why are emission reductions not yet visible in the measurements?
Alex Vermeulen, the Director of the ICOS Carbon Portal thinks that the standstill of emissions increase in 2015 and 2016 was offset by additional natural emissions due to the large El Nino that took place during the same period.
- El Nino events cause floods and droughts worldwide at many places in the tropics and (manmade and natural) fires associated with the droughts release considerable amounts of carbon dioxide (see more in the 12th WMO Greenhouse Gas Bulletin). This is one of the feedbacks between climate and the Earth system that ICOS intends to detect and study, says Vermeulen.
Also methane concentrations, the second most important greenhouse gas after CO2, have increased considerably since about 2006. This phenomenon is not yet well explained, but seems to be linked to changes in emissions from wetlands and also probably emissions from fossil fuel production and use.
Important interplay between land, ocean, and atmosphere
Vegetation on land and oceans are natural sinks for CO2. They absorb about half of the anthropogenic CO2-emissions from fossil fuel combustion and land use changes, which underscores the importance of understanding the interplay between the ocean, ecosystems on land, and the atmosphere. Hence, ICOS not only measures greenhouse gas concentrations throughout the climate system, but also the natural fluxes of gases between terrestrial and ocean surfaces and the atmosphere. Scientists will feed these measurements into advanced computer models that will calculate, for example, CO2-emissions across Europe.
The North Atlantic the most intense sink for CO2
The ocean is a critical factor damping the effect of man-made CO2 emissions, which, along with Norway’s long coastline, explains the large scientific interest in Norway regarding the ocean’s role in the climate system. Four of the twenty-one permanent ocean stations in ICOS are Norwegian.
- The oceanic climate milieu in Bergen has long traditions for observing concentrations of climate relevant gases in the North Atlantic, the Norwegian Sea, and in the Arctic, says Johannessen.
Johannessen adds that the North Atlantic is the most intense northern hemisphere marine sink for CO2, which highlights the importance of having long-oceanic observations. This will help not only to understand the processes that drive climate change today, but also to predict future behaviour of the global carbon cycle.
A new terrestrial station at Hurdal
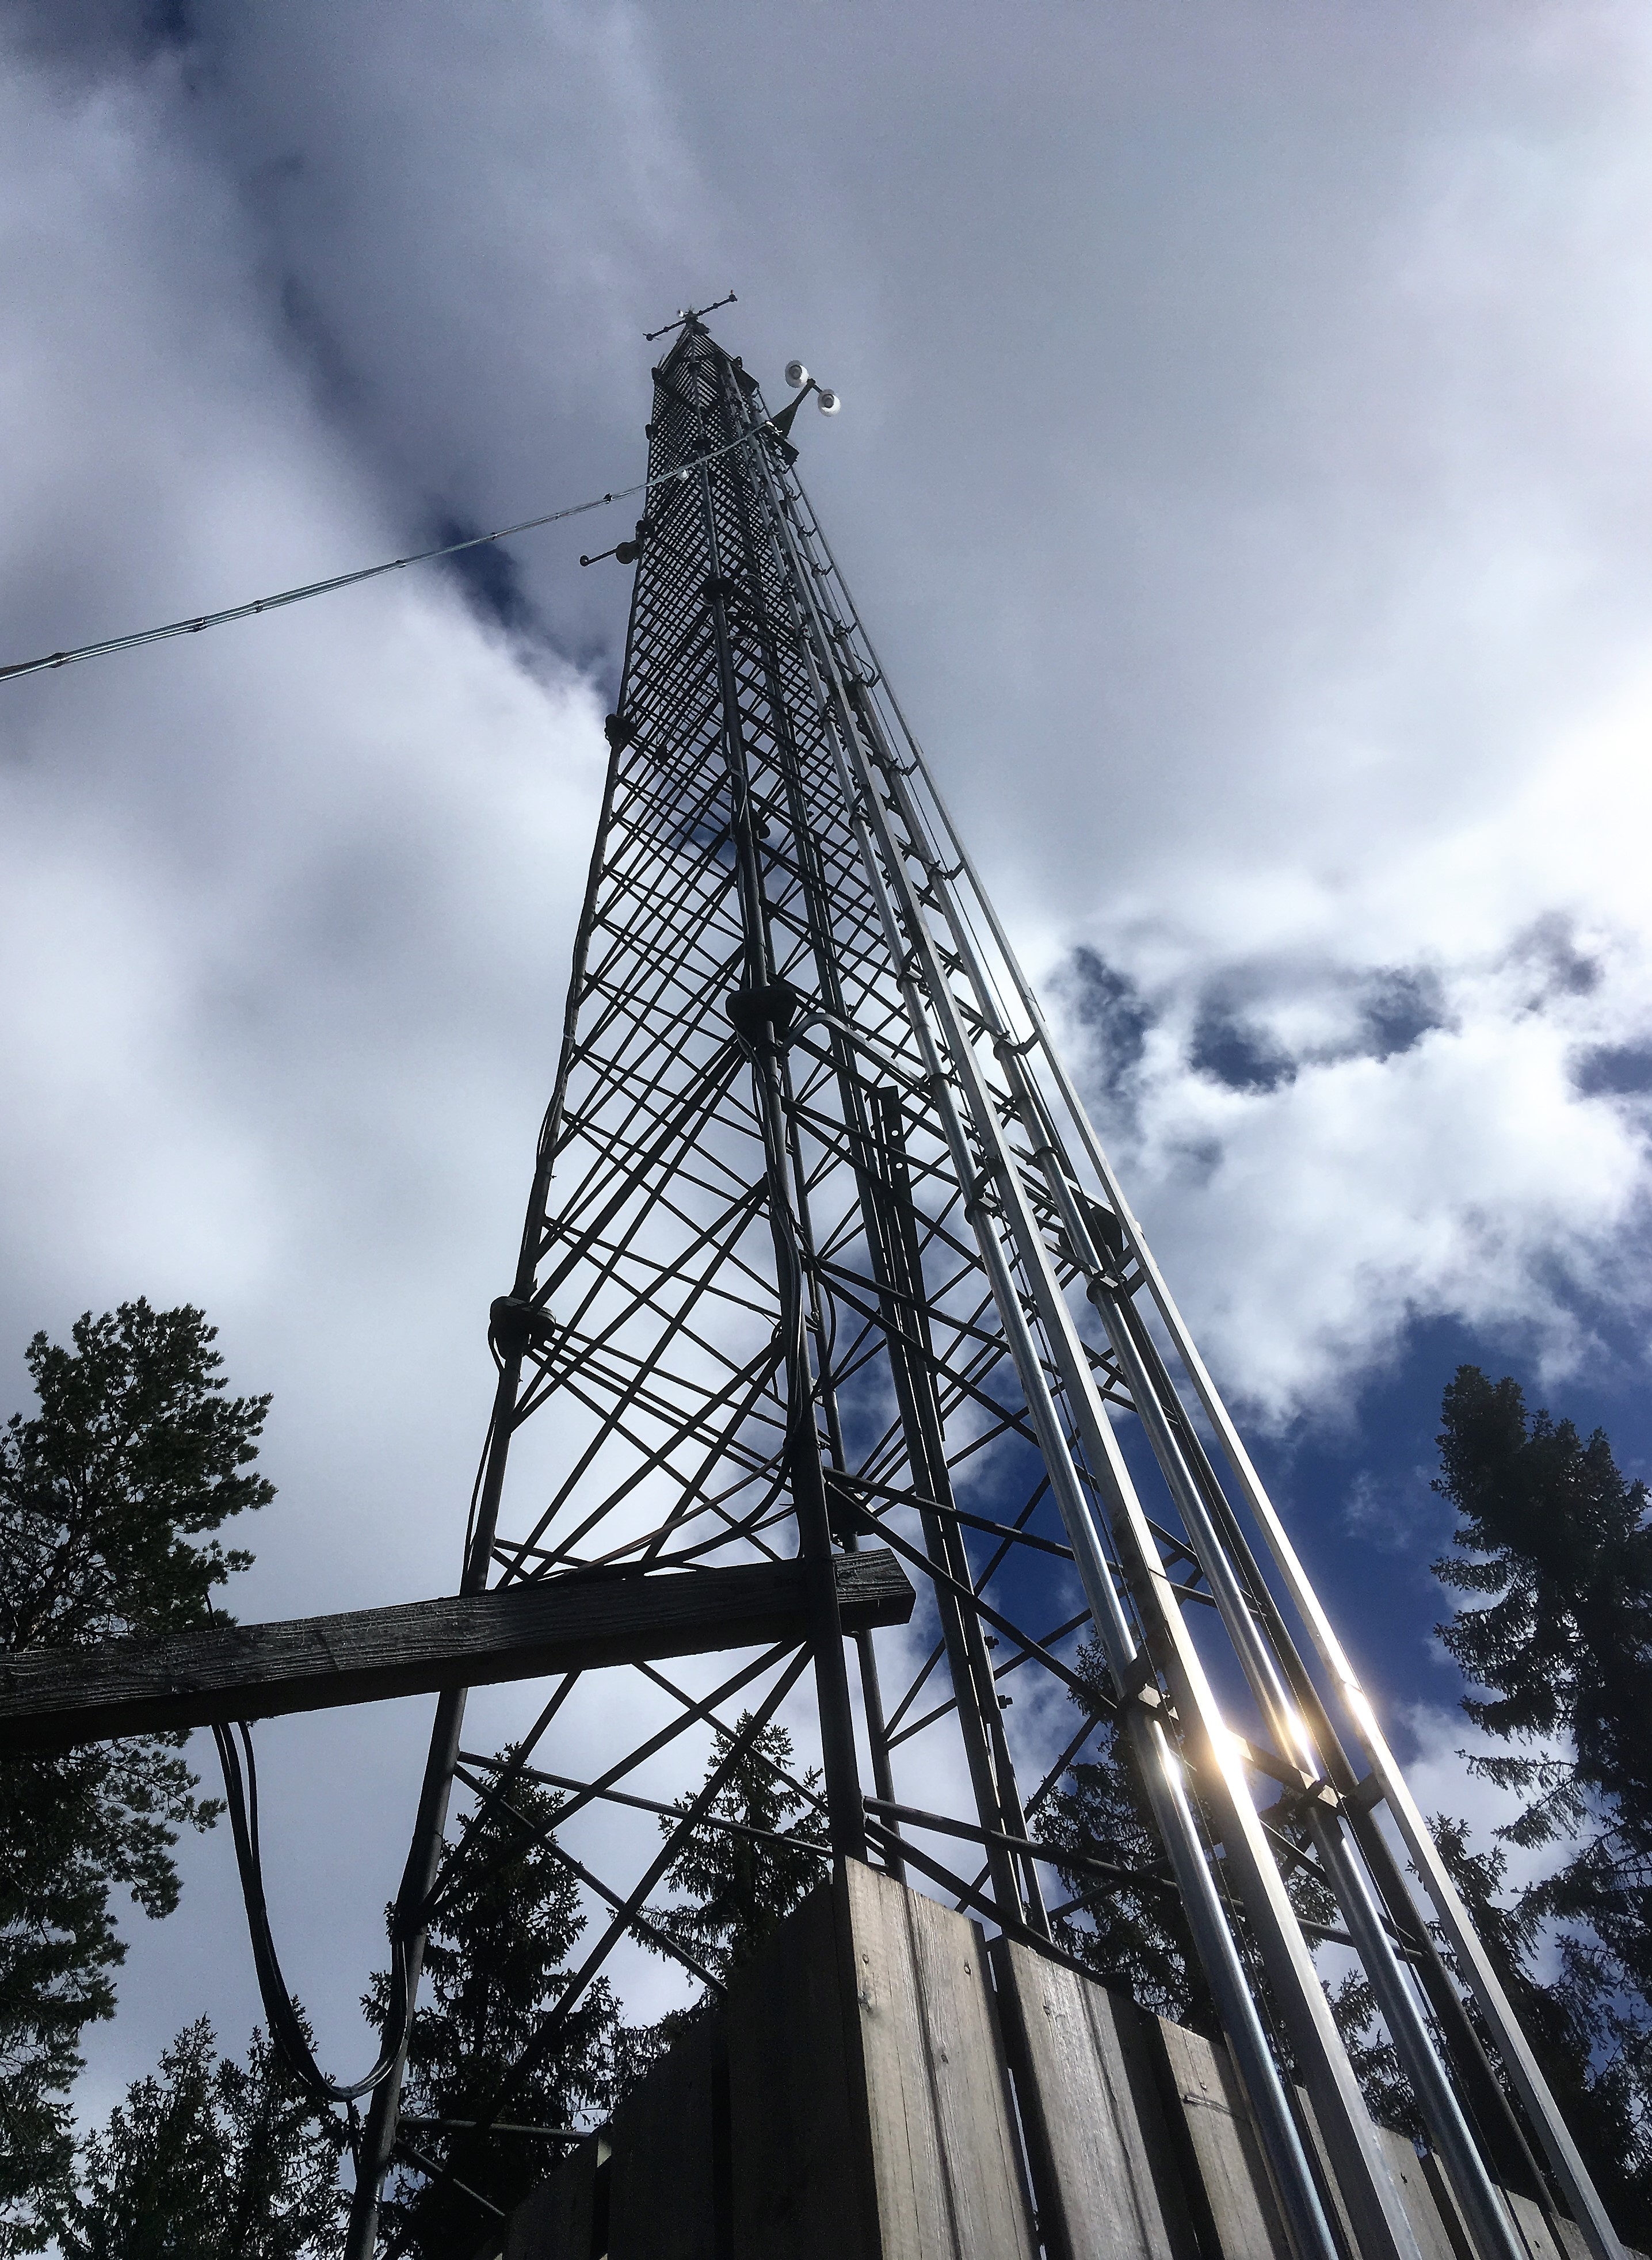
The ecosystem station of ICOS Norway will be located within a mature forest stand close to Hurdal Lake. Carbon fluxes between atmosphere and vegetation are measured using a tower reaching above the canopy.
- We will use an existing meteorological tower operated by NILU, which will be equipped with ICOS approved measurement devices this year, and will start the measurements early in 2018, says Holger Lange, research professor at NIBIO and Principal Investigator of the ecosystem station.
A representative from The Research Council of Norway, Jon Børre Ørbæk, said during the meeting that ICOS Norway is the largest infrastructure project that is funded by the Norwegian Research Council. He noted that in turn this would help to solve major society challenges.
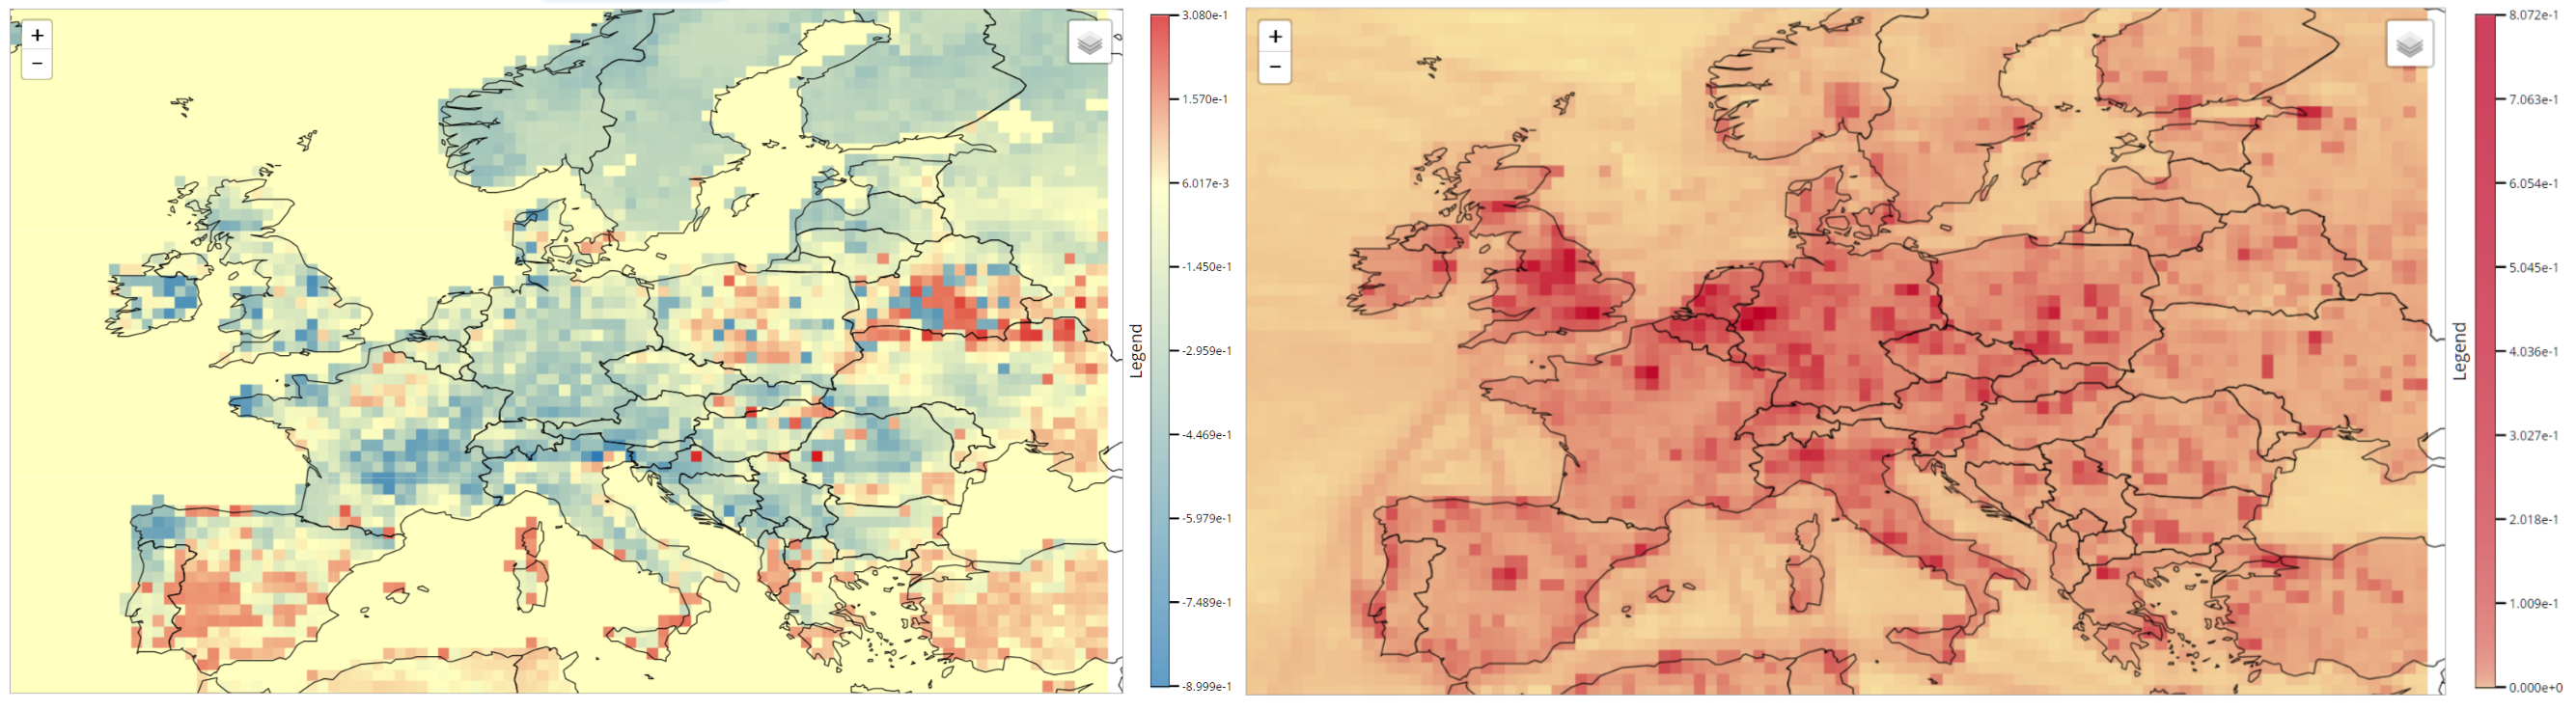
Visualizing nations’ footprints
In order to become ICOS-data ready, the ICOS thematic centres in Europe have worked out strict rules and protocols to secure standardised, high-precision observations. Furthermore, the data should be well documented, open and easy to access for all interested users and parties.
Through its Carbon Portal, ICOS aims to make it easy for policy-makers to find reliable measurements and estimates of greenhouse gas emissions, which can be compared with the reported emission targets and pledges to the UN.
The Carbon Portal is a “one stop shop” for all ICOS data. As soon as the official ICOS high quality data starts flowing summer 2017, users can search for the observation data. They can already view and download maps that visualize national footprints and the distribution of emissions across Europe.